It’s clear South Florida housing supply is falling. But, what I uncovered this past weekend shocked me.
Is a South Florida sellers market emerging?
Last week I wrote about how the Delray Beach Buyers Market is hanging on by a thread by focusing on our crashing housing supply. Today I’ll dive deeper and share more data I know you’ll find interesting.
While pulling reports from Realtors Property Resource (RPR – a subsidiary of our Multiple Listing Service where the entire industry gets their data), I saw a repetitive pattern in the Months of Supply (MOS).
Every zip code I looked at showed MOS below 6 months, and most hovering in the 2.75 – 4 month range (Below 6 months is a sellers market). Specifically:
* Boca Raton – 3.59
* Delray Beach – 3,61
* West Palm Beach 3.96
* Wellington – 3.66
* Lake Worth Beach – 3.87
The further west I looked, the lower the number and more evidence of a sellers market beginning.
When I look at this from a wider angle, although supply is falling fast, it’s still above where we were in South Florida in 2019. Back then we averaged around 53k units. So at today’s 57,249 units, we still have strong supply.
Sellers Market Data Begins
For now, supply is falling and MOS is crashing into sellers market territory. But don’t jump to conclusions. There’s more data to review that’ll show the pendulum hasn’t swung in favor of a sellers market, yet.
You see, there is still plenty of data reassuring buyers that it’s their market – but change happens fast.
First, not only are there still 57,249 units on the market today… but the time it’s taking to sell a home is still hovering 75 – 100 days.
Next is a statistic I’m leaning into – Sold-to-(original) List Ratio (STL). For the communities listed above, I see it hovering between 87 – 90. See the Delray Beach graph below.
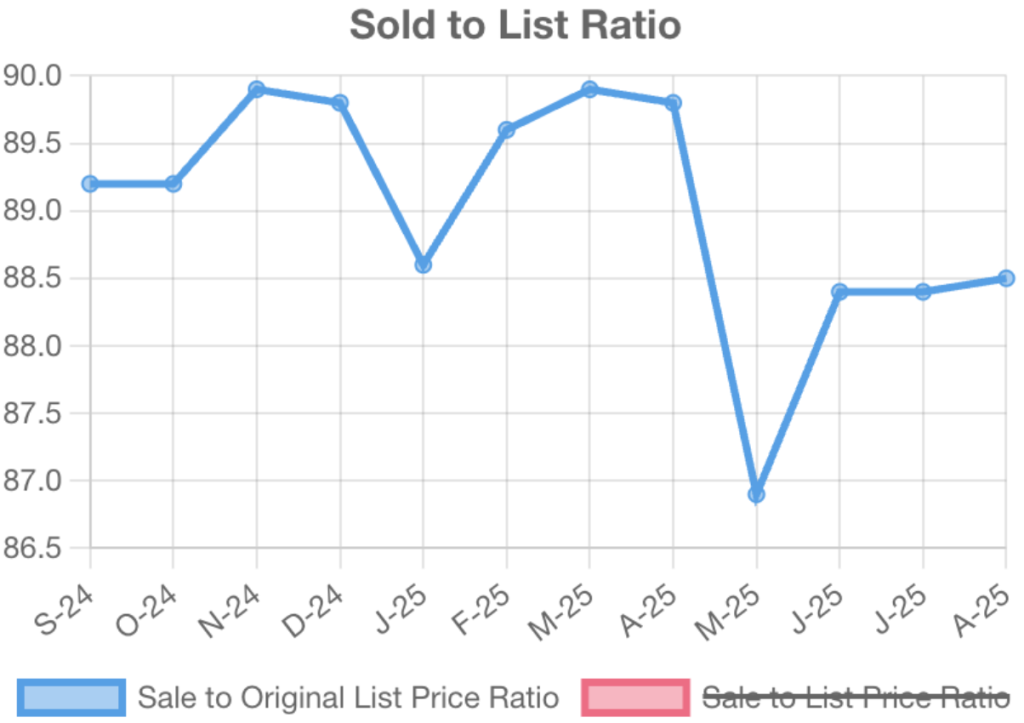
This means properties are selling for a discount of 10-13%. So a home listed at $600k is selling between $522k – $540k.
And here’s where it get’s more interesting. The active/current median home price drop for all South Florida properties today is 6.85%. That means a home originally listed for $600k, dropped their price and is now listed for $558,900… and it’s still not sold.
With over 57k listings to choose from today, buyers still have the upper hand until we see Days on Market fall and STL rise. For now, there’s no data pointing to this happening. So you could say sellers market data is not conclusive, yet.
And the final point for today is the amount of listings that expired over the last 12 months. In the last year, 43,151 South Florida listings expired. This means a seller’s property was either miss-priced (too high), marketing exposure and strategy lacked, or the seller was nervous with the lack of interest or the type of offers they may have been receiving.
If these owners are still potential sellers, we could see a rise of active listings return to the market again.
There’s a lot going on in today’s real estate market for me to analyze and keep you current. My eyes are glued on the MOS and falling active listings. If this continues, a sellers market may appear sooner than later.
(Main photo: Sunset pouring colors above my home last Friday night)
—————————————————
*** Tennis Fans: Davis Cup / The World Cup of Tennis is this Friday and Saturday, Sept 12-13 at the Delray Beach Tennis Stadium (weather permitting)
*** Are you selling and buying a home at the same time? This essay about Bridge Loans may be worth a read
*** Enjoying my YouTube videos lately? My latest is a fun look at Where The Wealthy Live in Delray Beach
*** TODAY is the Peak day of hurricane season in Florida. But with 60 days left, it’s far from over
——————————————-
*** South Florida Real Estate Inventory is ABOVE 2019***
Last week’s supply was 57,242
Today’s supply is 57,249
*** Supply was flat last week ***
*** Supply is DOWN 16 of 18 weeks and Down 18% From April’s high***